By Shawn Jaryno, Associate Broker, EXIT on the Hudson Realty, NJ
Introduction
The real estate market in New Jersey has seen several dramatic swings, with housing bubbles inflating and bursting over the past few decades. These swings coincide with the national level swings that have taken place.
Did you know? In the past 40 years, New Jersey’s housing market has undergone four major bubbles, each followed by significant corrections. As we approach another potential peak, understanding these patterns can help homeowners, investors, and policymakers navigate the uncertain times ahead.
This short study aims to predict the future peak of the current housing bubble, estimate when it will burst, and forecast when home prices will stabilize. The analysis uses historical data from previous bubbles, economic conditions, and the impact of inverted yield curves
Historical Context
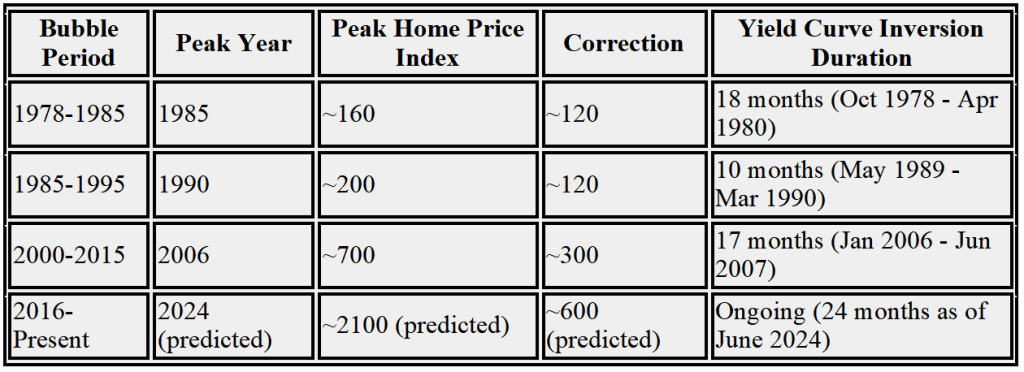
New Jersey’s housing market has experienced significant bubbles during the late 1970s, late 1980s, early 2000s, and the current period starting in 2016. Each of these bubbles followed a pattern of rising home prices and subsequent sharp corrections. Notably, each bubble was preceded by an inverted yield curve, where long-term interest rates fell below short-term rates, indicating potential economic downturns.
Key Historical Bubbles
Predictive Analysis and Graphs
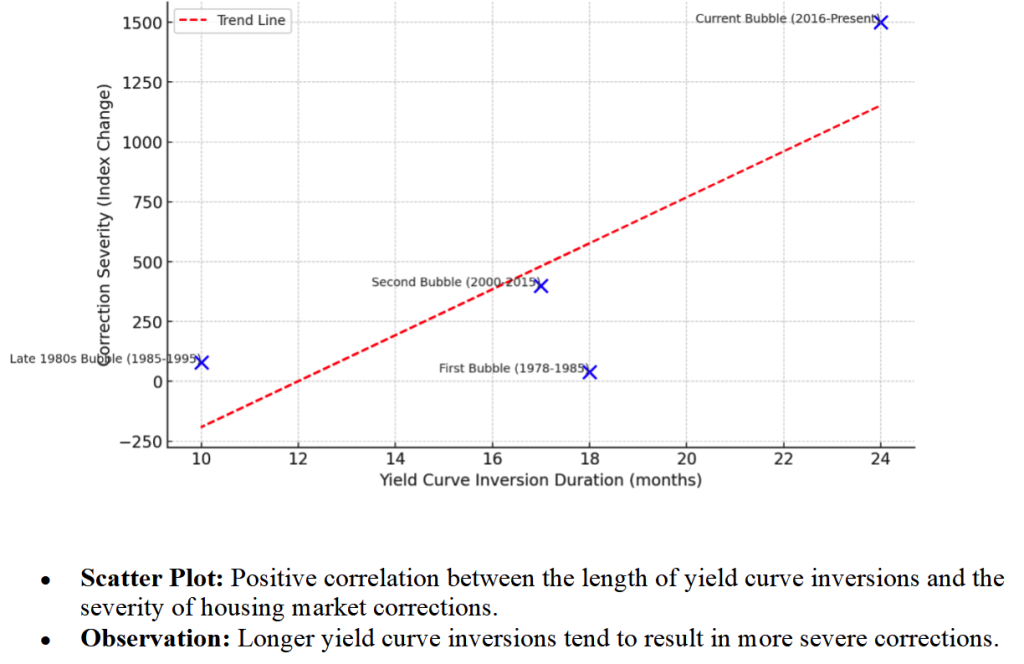
Correlation Between Yield Curve Inversion Duration and Housing Market Correction Severity:
Findings and Predictions
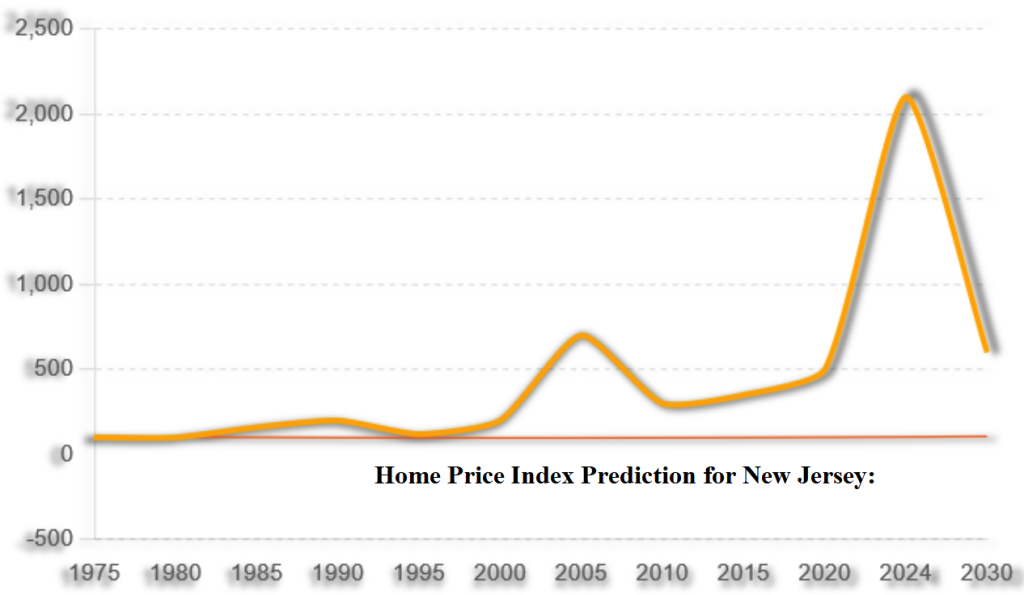
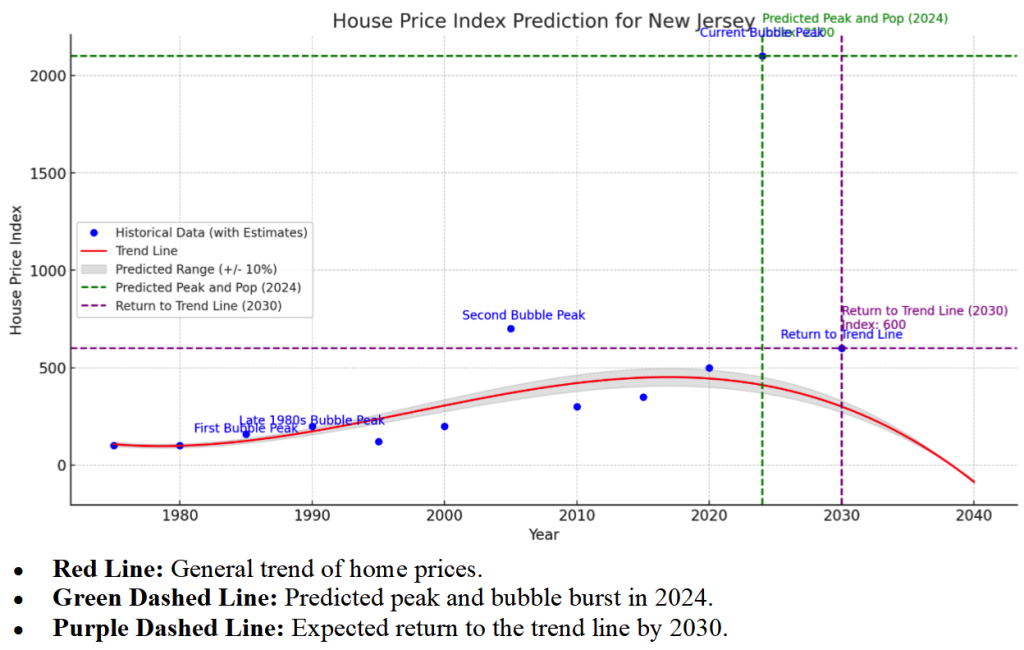
· Peak Prediction: The current housing bubble in New Jersey is expected to peak around 2024, with a home price index of approximately 2100.
· Correction Prediction: Following the peak, home prices are projected to correct significantly, potentially falling to around 600 by 2030.
· Yield Curve Inversion: The ongoing yield curve inversion, which began in July 2022 and has lasted 24 months so far, suggests a severe upcoming correction.
· Historical Correlation: Longer yield curve inversions have historically led to more drastic corrections in the housing market.
Conclusion
This analysis provides compelling evidence that the current housing bubble in New Jersey is likely to follow the pattern of previous bubbles. The predicted peak of approximately 2100 in 2024 aligns with historical trends, and the significant correction to around 600 by 2030 is consistent with past market behaviors following prolonged yield curve inversions.
By understanding these patterns and recognizing the correlation between yield curve inversion durations and market corrections, stakeholders can better prepare for the potential impacts on the real estate market.
Homeowners should consider the timing of buying and selling decisions, investors might reassess their strategies, and policymakers need to be vigilant about economic signals. Historical data from previous bubbles, such as those in 1985, 1990, and 2006, support these predictions and emphasize the importance of economic indicators in forecasting market trends.
As we move forward, keeping an eye on upcoming economic indicators and events will be crucial in navigating the market’s future. This vigilance will help mitigate risks and capitalize on opportunities as the market evolves